Building Economic Trust in Solver-Based Networks – Part 2: The State of Competition
This article is based on the talk ‘Rethinking Competition in Solver-Based Networks’ given at Protocol Berg in Berlin, June 13th 2025.
In Part 1, we introduced the concept of economic trust as a necessary complement to cryptographic trust in solver-based networks. We argued that economic trust is not just about verifying code or signatures, it’s about trusting systems of incentives, access, and enforcement to produce outcomes that are fair, resilient, and decentralized.
But trust doesn’t emerge in a vacuum. It is shaped, in large part, by the market structures in which solvers operate. In Part 2, we explore how today's competition models in solver-based protocols are evolving — and in some cases, replicating the same centralization dynamics we hoped to escape.
The Rising Costs of Being a Solver
Solving typically unfolds in five key steps. While the general structure holds across intent types, the specifics, especially around execution and risk, can vary significantly. First, let’s walk through the common process. Then we’ll compare how it applies across different solving contexts:
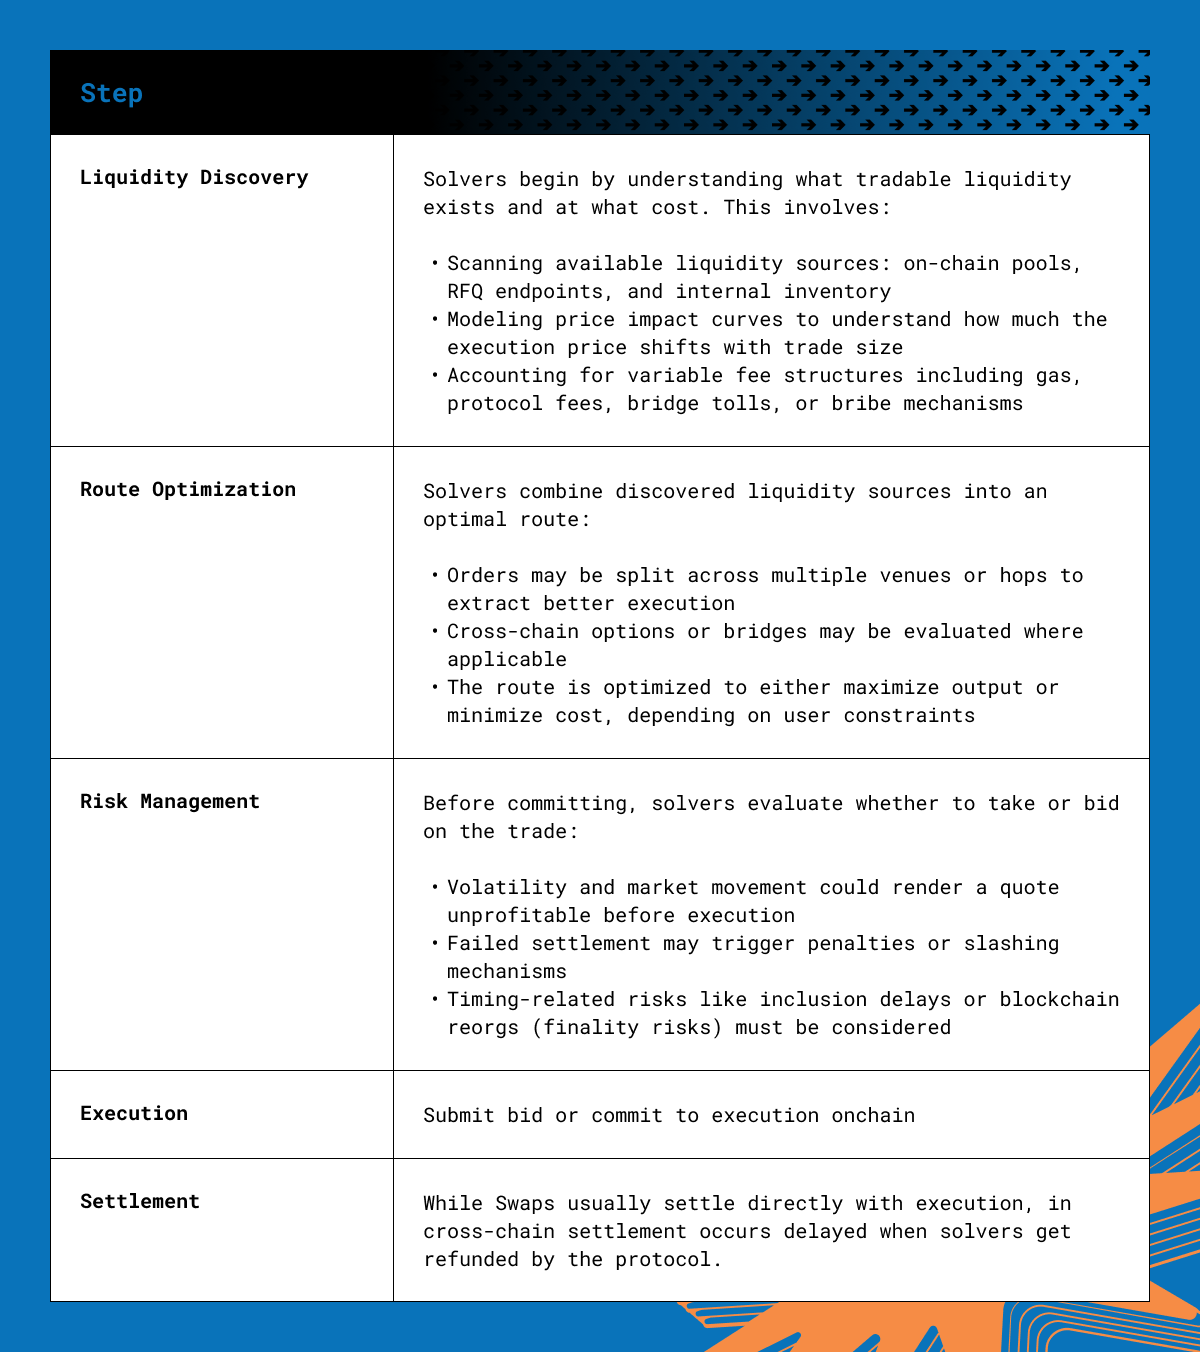
Each of these tasks requires building out and maintaining infrastructure: real-time data ingestion, fast simulation engines, and tightly coupled onchain/offchain orchestration. Therefore running a production-grade solver is no longer a weekend project - assuming you want to capture at least 1% of relevant order flow.
Based on our own experience and discussions with numerous solver teams across different protocols, we estimate that costs for operating a production-grade solver typically range from $13,000 to $26,000/month. And that’s before accounting for penalties, slashing, or capital lock-ups.
The State of Solver-Competition: Case Studies from the Field
Let’s look at two prominent protocols: CoW Protocol and Across.
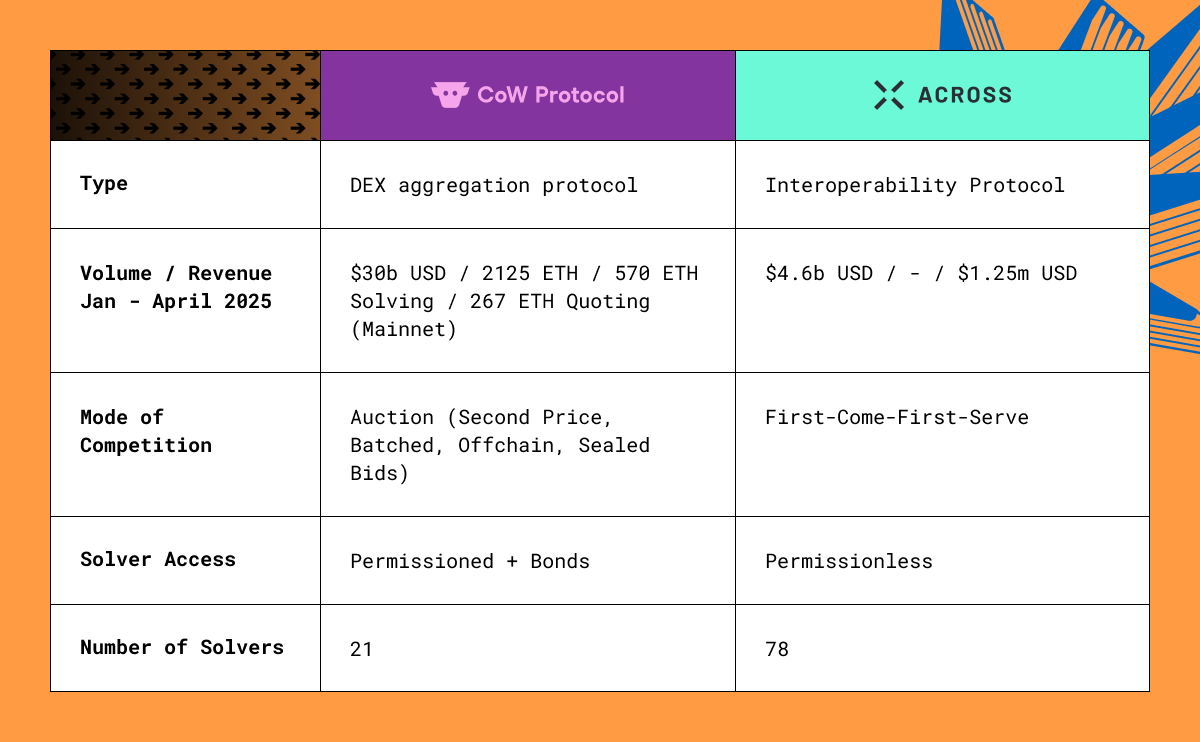
We analyzed profits and solver participation for both for the first four months of 2025 based on the available on-chain data (mostly Dune) and anonymized the solver names.
CoW Swap – Trading Volume & Rewards
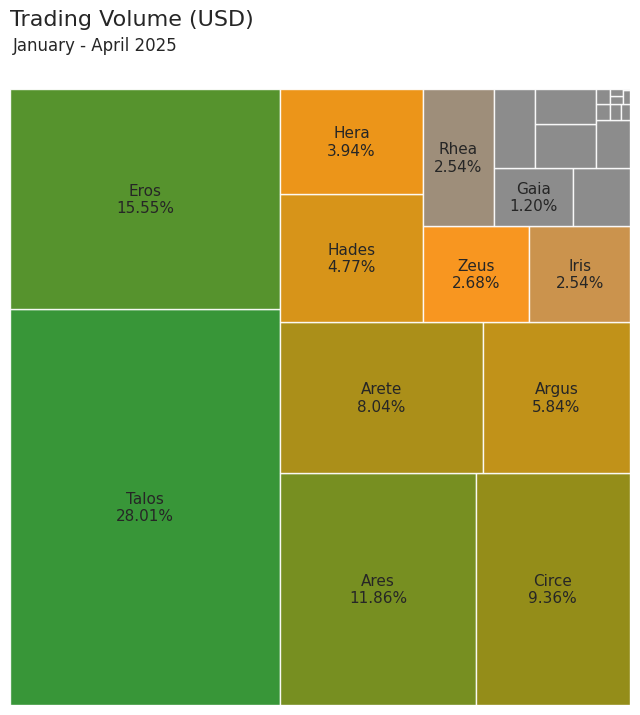
The data shows that out of 28 total solvers active on CoW Protocol, only 12 handled more than 1% of trading volume in the first four months of 2025. Remarkably, just three solvers account for over 50% of all volume, underscoring a steep concentration of execution power.
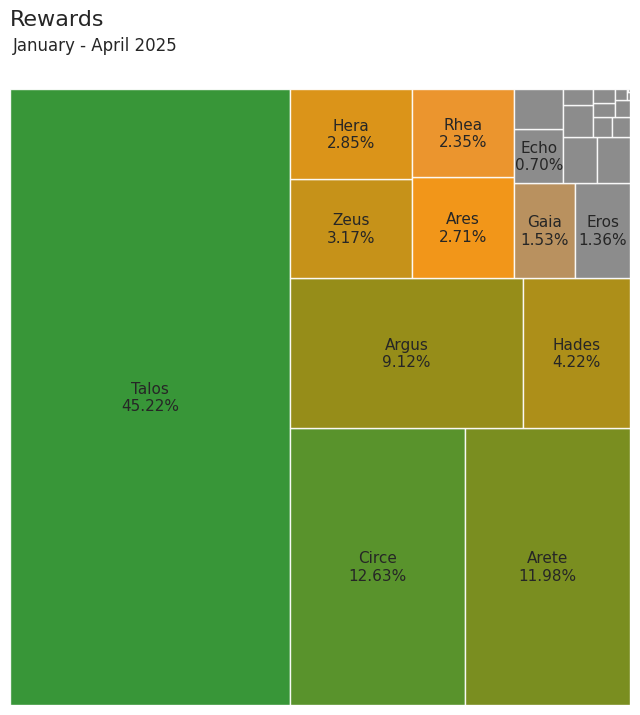
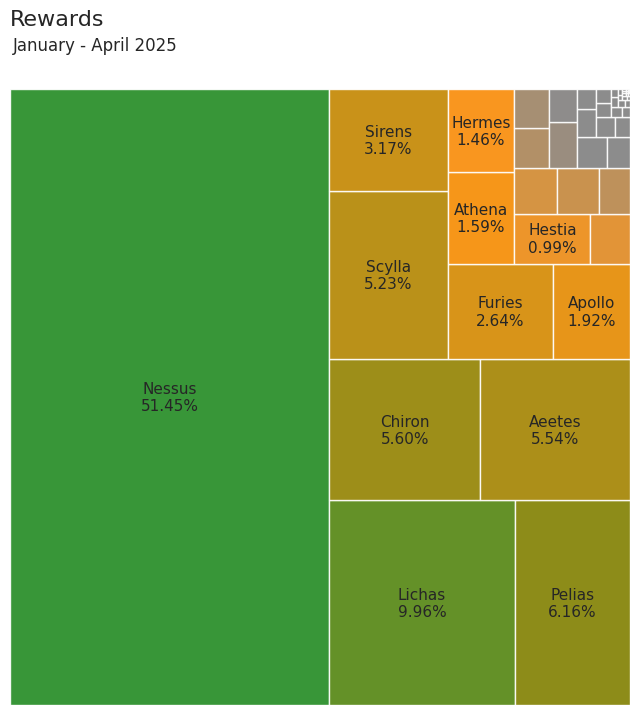
The rewards picture is even more top-heavy. Among the top three solvers, one stands out as an outlier—capturing nearly 50% of all rewards.
It’s important to note, that the reported rewards here are pure protocol rewards as reported by CoW and solvers might have other sources of revenue from arbitrage and/ or positive slippage for example that we are going to analyze at a future time.
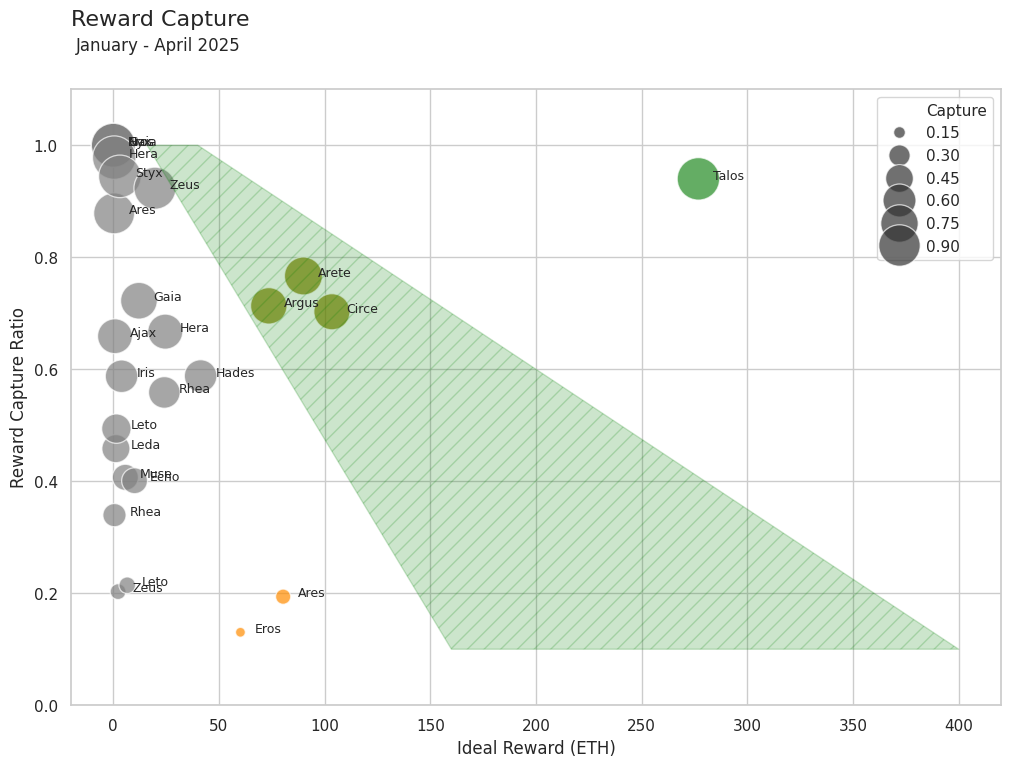
The chart plots the share of ideal rewards captured by each solver over the analysis period. The x-axis shows individual solver identities (anonymized), while the y-axis reflects the percentage of ideal rewards successfully captured. Ideal rewards refer to the maximum reward available to a solver upon winning an auction, assuming optimal execution and successful settlement. The green band reflects, based on the cost estimations above - the survival zone of solvers where we assume solvers to be able to cover their costs.
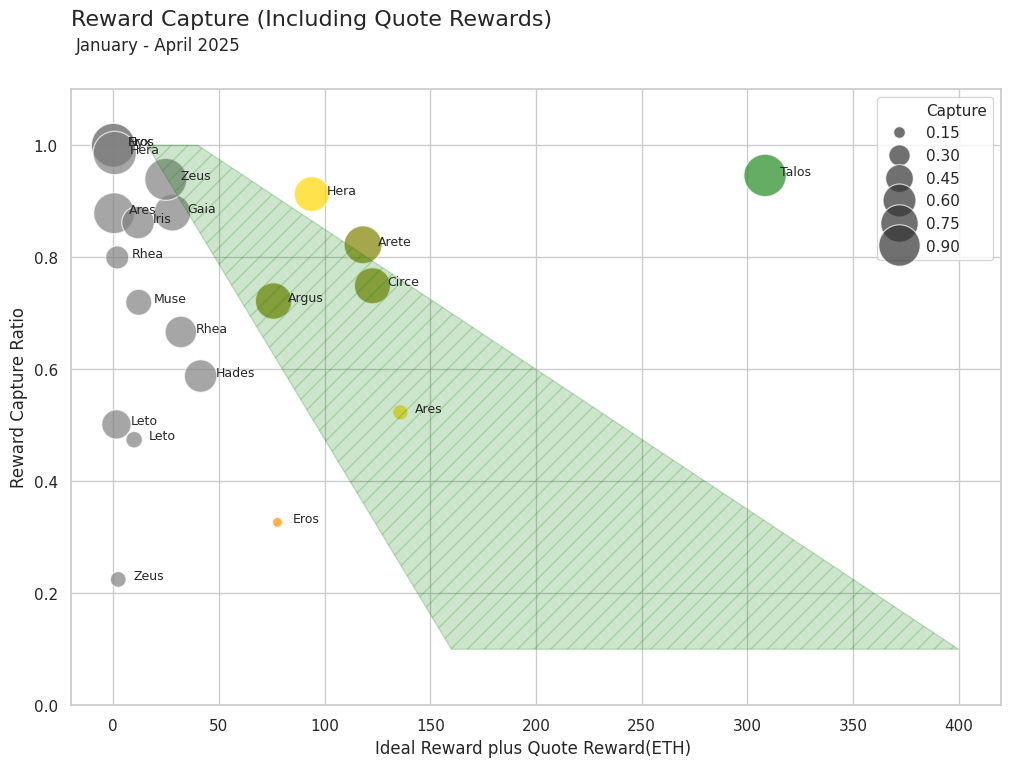
In response to community feedback, we refined our analysis by including quote rewards, which account for a non-trivial share of income for some solvers. We highlight in yellow those solvers whose position shifts into the estimated survival zone due to these rewards. While this adjustment does improve the outlook for a few actors the broader distribution remains consistent: a handful of solvers extract most of the rewards, and the rest remain under persistent pressure. The underlying asymmetry tied to access to liquidity, inventory, and infrastructure continues to dominate.
Based on observed auction behaviour, we identify four strategic solver archetypes:
- Noisy Solvers (Grey): Characterized by sporadic participation and inconsistent performance. These solvers likely operate with limited alpha, generic heuristics, or outdated strategies. Their wins are infrequent and appear more random than targeted. This group likely includes altruistic solvers motivated by non-monetary goals—such as providing backstop liquidity or supporting specific protocols—as well as lean independent teams operating with minimal costs. From a systemic perspective they are unlikely to reliably challenge the pricing of top solvers, particularly those with scale, capital, and privileged liquidity access.
- Optimizers (Orange): Solvers who focus on onchain liquidity and routing, attempting to win a high number of auctions by offering attractive prices. This comes at the cost of higher settlement risk — particularly in cases of volatile public liquidity.
- Multi-Strategy Solvers (Olive): These solvers balance selectivity and infrastructure sophistication. Likely using private liquidity in certain paths or fallback strategies, they maintain lower failure rates while staying close to break-even. Their approach appears to be about survival through efficiency, not dominance.
- Vertically Integrated Solvers (Green): A class of full-stack operators combining deep capital, internal inventory, CEX connectivity, and minimal reliance on public liquidity. These solvers win selectively, capturing high-value intents where they can extract the full spread with low failure risk. Their edge often stems from privileged relationships — including low or zero trading fees, direct CEX access, or even preferential credit lines — and may extend to alignment with builders or validators, further consolidating control.
The chart clearly shows a two class solver landscape — where access to privileged liquidity separates the top performers from the rest of the competition.
After presenting this analysis, we received valuable feedback from the CoW Protocol community, specifically pointing to nuances in solver profitability and strategy that are not fully captured in our current data lens. A few key points:
- Cost models vary widely: Some solvers operate lean, even part-time, while others resemble prop trading firms with significant infrastructure budgets. This means our baseline cost estimates likely represent an upper-middle range.
- Profit beyond protocol rewards: Solvers with alpha on certain routes or privileged liquidity access may extract profit outside of the reward mechanism. For example, quoting strategies, retained slippage, profits from arbitrage or optimized flow execution could yield additional margins not visible in reward capture metrics.
- Survivorship bias & persistence: While charts show stark reward concentration, the long-term presence of many solvers suggests some are sustainably profitable in ways not directly observable from public reward data alone.
Our response to this:
We fully agree that solver strategies and infrastructure vary widely, and that profitability can be augmented through alpha extraction, preferential liquidity access, and cross-protocol optimization that are not fully captured by our analysis.
Furthermore it’s a bit simplistic to infer profitability from rewards alone, especially in a landscape where short-term losses may be accepted to build positioning/ reputation or gain market share. That said, comparisons to ultra-lean solver or one person setups — while valid, should be made with caution. These operations may indeed exist and succeed today, but they are often idiosyncratic, difficult to replicate, and may not scale sustainably in a competitive or professionalizing ecosystem. Designing protocol dynamics with these edge cases as the baseline risks underestimating the infrastructure investment required for a resilient and diverse solver set.However, we believe reward capture data reveals behavioral clusters that hint at distinct operational solver archetypes as we have described above. We see this clustering as useful for interpreting solver strategies—beyond binary profitability metrics. We’re continuing to refine our methodology and welcome more collaborative insight from teams active in the space.
Across Protocol– Trading Volume & Rewards
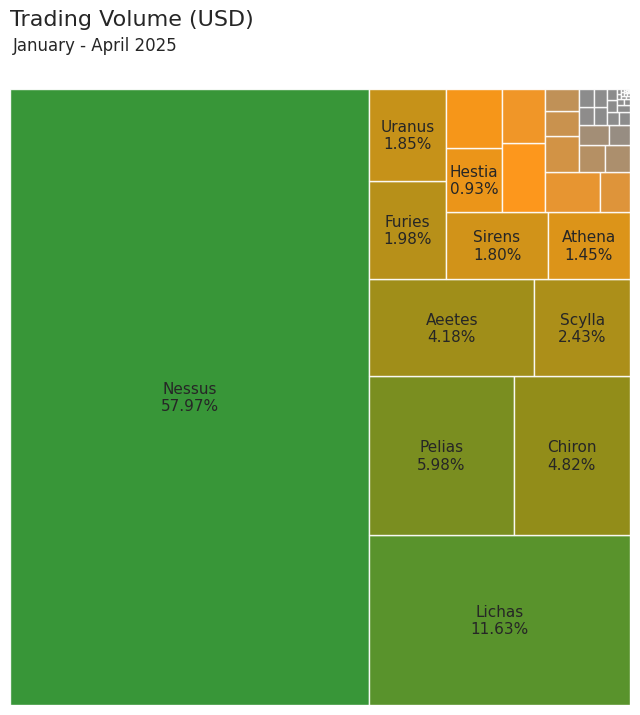
The chart provides a view of solvers and their respective share of volume and rewards (revenue) in the first four months of 2025. What we observe:
- $4.6 billion USD in total volume, 10 out of 78 solvers process at least 1% of this volume.
- 'Nessus', the solver operated by the team behind Across, covers the largest share of the bridge volume. This solver does not really take part in competition: it waits for other solvers to fill and only steps in as a last resort. That this solver is capturing roughly half of the volume might indicate that there are not enough incentives for other solvers to capture this volume and/ or hold the required inventory needed.
- The rewards distribution broadly mirrors the volume curve: a few solvers dominate, while most only contribute minimally to the overall economic activity.
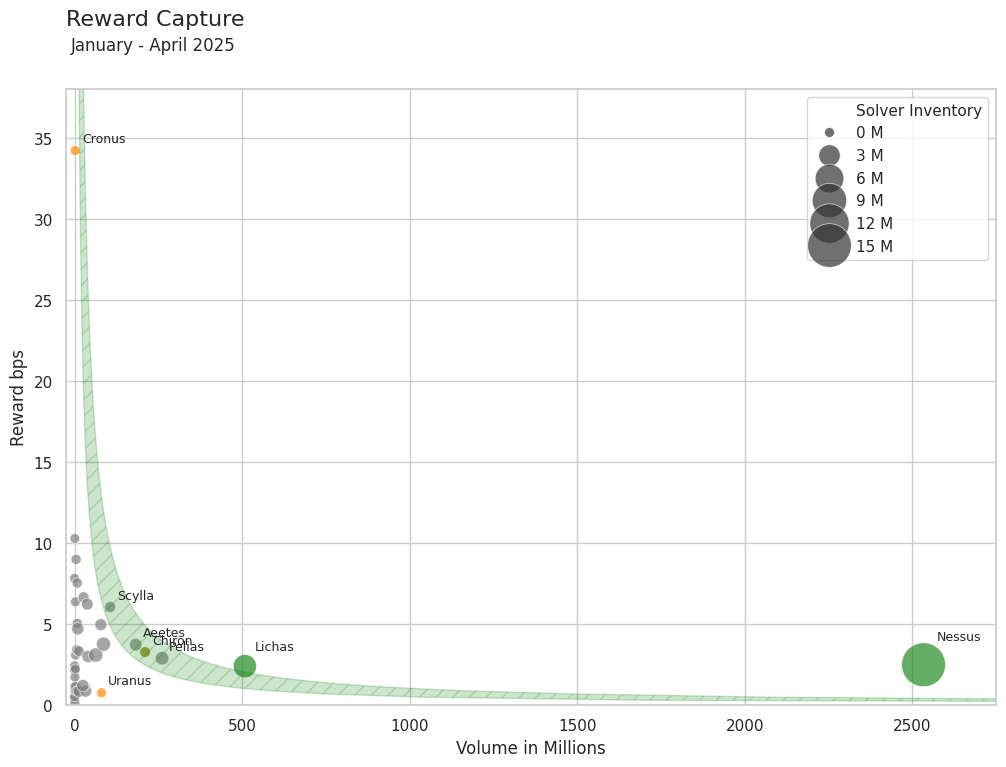
This chart examines for participating solvers the bridge volume in Millions handled as well as the achieved revenue rate (in basis points - bps) for that volume. The green band reflects, based on the cost estimations above - the survival zone of solvers where we assume solvers to be able to cover their costs. Furthermore the solver dot size indicated the amount of available inventory in US Dollars.
What we observe:
- Out of 78 total solvers, 5 to 10 solvers are profitable under the cost assumptions made — one of which is external (Lichas).
- The top-performing external solver ‘Lichas’ benefits from significantly more liquidity—holding over $3.7 million USD in inventory, compared to less than $600k for most peers.This liquidity advantage enables economies of scale as it substantially reduces rebalancing costs and enables to fill more tokens and larger orders.
After publishing our analysis, we received valuable feedback from the Across team, particularly around solver costs, data assumptions, and the broader ecosystem structure. Below we respond to some of the key points raised:
Cost Assumptions
We agree that the cost to run an Across solver is likely on the lower end or even below the mentioned range of $13,000–$26,000/month, particularly compared to more complex solving environments like CoW Protocol. A number of lean, one-person solver setups exist and in some cases are quite profitable. However, our goal was to show the spectrum of operational complexity across different solver networks, with CoW and Across representing two useful endpoints.
From a systemic perspective, relying on one-person solvers is risky, kind of like in the Uber model: great at first when market expansion is incentivized, but not necessarily sustainable once incentives and costs normalize. And realistically, most indie teams won’t be able to beat professional top solvers long-term
Clarifications on Methodology used
- Reward BPS: Our revenue rates account for gas costs, but not failed transactions. Including failure-related costs (especially for fills without reimbursements) would likely worsen the outlook for some solvers. We also tracked priority fees, and noticed that some solvers pay up to 25% of potential revenue in tips—an often-overlooked factor.
- Inventory Sizing: To estimate solver liquidity, we sampled wallet balances over time. For each solver, we used the maximum sustained balance (held for at least x consecutive days) to approximate minimum accessible capital. This method is imperfect—it misses private rebalancing strategies, shared capital pools, and non-transparent funding sources—but gives a directional sense of who holds inventory advantage.
- Rebalancing Costs: These are a critical missing component. Due to a lack of standardized reporting or public visibility, we didn’t include them. If better heuristics or tools emerge, we’d love to incorporate them into future versions.
- Solver Landscape: Across's high number of solvers relative to CoW is likely a direct function of low entry barriers and permissionless participation. This is a strength, but also means a long tail of solvers may remain economically unviable over time. In contrast, CoW’s permissioned structure and high bond requirements create natural gatekeeping and lead to a more concentrated solver set.
Potential Future Research
- Inferred cost, i.e. asking what cost level would make X% of solvers profitable based on observed rewards. We’re exploring this approach, but it depends heavily on improving our underlying cost and revenue models.
Summary: What We’ve Learned from CoW and Across
Analyzing CoW Protocol and Across side by side highlights several structural realities of today’s solver markets:
- Winner-takes-all dynamics: A small number of top solvers dominate volume and rewards.
- Most professional solvers aren’t profitable: While user welfare improves, margins remain thin for the majority of participants. Solving is largely a reputation game and solvers are looking for other areas of revenue such as Arbitrage/MEV, Solver Infrastructure or privatizing orderflow via dedicated Swap APIs.
- Liquidity access is key: The biggest centralizing forces are capital requirements and access to non-public liquidity—far more than logic or latency.
- Protocol-level improvements are underway, but current adjustments are unlikely to shift the underlying incentives in a meaningful way.
These findings underscore the need to design not just for user welfare, but for contestability, sustainability, and long-term resilience.
Looking ahead, Part 3 will explore potential solutions to these challenges by drawing insights from traditional finance and the ethereum builder landscape, to help build more resilient, fair, and sustainable solver-based networks.
Thank You
We’re incredibly grateful to the teams at Across and CoW Protocol for their thoughtful, constructive feedback. Their openness, technical insight, and willingness to engage critically helped surface important nuances we couldn’t have captured alone.
The goal here isn’t to discredit the involved protocols or present a final or definitive model, but to kickstart a deeper conversation around solver economics, sustainability, and protocol design. We hope it encourages more open data, better tooling, and ultimately, healthier competition across the ecosystem.
If you’re a solver, protocol designer, or researcher, we’d love to hear your thoughts and keep the dialogue going!
Join us on our mission to shape the future of crosschain!
🏃♂️ Follow us on X
🏃Visit us at Sprinter.tech